If you are planning retirement in Canada, you have likely asked yourself one question more than any other: “How much CPP will I actually receive each month?” It is easy to look at the maximum Canada Pension Plan (CPP) number, $1,507.65 per month in 2026, and assume that is what you will get. But the reality for most Canadian retirees is very different. Understanding the average CPP payment gives you a much more honest and realistic picture of what to expect. This blog breaks down the real numbers, explains why most people do not get the maximum, and shows you how the average CPP payment fits into your total retirement income.
Average CPP Payment in Canada (January 2026)
According to the Government of Canada, the average monthly CPP retirement pension for new beneficiaries starting at age 65 is $925.35 per month (as of January 2026). That means most retirees receive roughly $11,104 per year from CPP alone.
| Type of Amount | Monthly Amount (Age 65) |
| Average CPP Payment (what most people get) | $925.35 |
| Maximum CPP Payment (very few qualify) | $1,507.65 |
The difference is nearly $600 per month. Over one year, that adds up to over $7,000 less than the maximum.
Why Do Most Retirees Get the Average CPP, Not the Maximum?
The maximum CPP payment is not automatic. To qualify for the full $1,507.65 per month, you would need to meet three tough conditions:
| Requirement | Details |
| Earnings Level | Earn maximum pensionable earnings (~$71,200+ per year) for most of your career |
| Contribution Period | Contribute to CPP for ~39 years (ages 18 to 65) |
| Pension Start Age | Start pension at exactly age 65 |
Very few Canadians achieve all three. Most people have some years of lower earnings, time out of the workforce, or choose to start CPP early at age 60 or late at age 70. Each of these factors reduces or changes the monthly amount.
Other CPP Benefits: What Else Could You Receive?
CPP is not just a retirement pension. If you become disabled, pass away, or are a survivor, other benefits exist. Here are the average amounts for 2026:
| Type of CPP Benefit | Average Monthly Amount (January 2026) |
| Retirement Pension (age 65) | $925.35 |
| Disability Benefit | $1,210.86 |
| Post-Retirement Benefit (age 65) | $11.93 |
| Survivor’s Pension (younger than 65) | $545.71 |
| Survivor’s Pension (age 65 and older) | $334.24 |
| Combined Survivor’s & Retirement Pension (age 65) | $1,140.69 |
The post-retirement benefit is a small extra amount you can earn if you work while already receiving your CPP pension (under age 70).
How Does the Average CPP Compare to Total Retirement Income?
CPP is only one part of your retirement income. Do not assume CPP alone will cover all your expenses. According to Statistics Canada, the average after-tax retirement income for senior families was $74,200 per year ($6,183 per month). For individual seniors, it was $33,600 per year ($2,800 per month). That total income usually comes from these three sources:
| Income Source | Details |
| CPP | Average $11,104 per year |
| Old Age Security (OAS) | Up to $8,560 per year (ages 65–74, 2024) |
| Personal Savings | RRSPs, TFSAs, workplace pensions, or other investments |
If you are an individual senior with $33,600 in total after-tax income, CPP ($11,104) covers roughly one-third of that. The rest must come from OAS and your own savings.
What Affects Your Personal CPP Payment?
Your actual CPP payment could be higher or lower than the average. Here are the most common factors:
1. The age at which you start getting CPP
- Start at age 60: Your payment is permanently reduced (0.6% per month = 36% less than age 65).
- Start at age 65: You get your full calculated amount.
- Start at age 70: Your payment is permanently increased (0.7% per month = 42% more than age 65).
2. Your contribution history
Years with low or no earnings reduce your average. However, CPP automatically excludes up to 8 years of your lowest earnings to help you.
3. Periods of raising children or disability
If you took time off work to raise young children or received a CPP disability pension, CPP may drop out those low-earning years, which can raise your final payment.
Understanding with a suitable example
Let’s look at a typical retiree named Susan.
- She worked for 35 years, mostly in moderate-paying jobs.
- She earned an average of $50,000 per year (below the maximum pensionable earnings).
- She started CPP at age 65.
- Susan’s CPP payment is likely close to the average: $925 per month ($11,100 per year).
- She also receives OAS: approximately $713 per month ($8,556 per year).
- Her total government retirement income: $1,638 per month ($19,656 per year).
To live comfortably, Susan needs additional savings from her RRSP or TFSA to reach the average senior individual income of $2,800 per month.
Can You Increase Your CPP Payment?
Yes, you can boost your CPP payment, but only within limits.
- Work longer before starting CPP. Each extra year of contributions can replace lower-earning years.
- Delay your CPP start to age 70 for a larger monthly amount (if you have other savings to live on in the meantime).
- Check your contribution record in your My Service Canada Account. Fix any missing years.
Even if you do everything right, your CPP payment will still depend on your lifetime earnings. The average is the average for a reason; most retirees fall in the $900 to $1,000 per month range.
Plan the CPP with the Average, Not the Maximum
When you plan your retirement, do not assume you will get the maximum $1,507.65 per month. Use the average $925.35 as your realistic starting point. Then ask yourself: Can I live on $925 per month from CPP plus OAS and my savings? If the answer is no, you have time to save more, work longer, or adjust your retirement expectations. Knowing the average CPP payment helps you build a retirement plan that is honest, practical, and achievable.
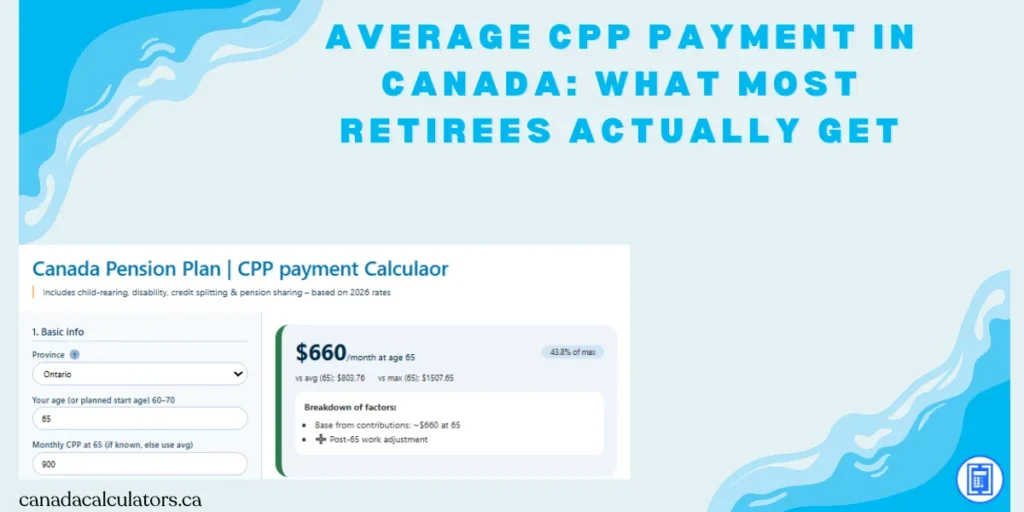
Stop guessing how much CPP you will actually receive. Visit CanadaCalculators.ca’s Free CPP Payment Calculator to get a personalized estimate in under two minutes. Simply enter your age, average earnings, and expected retirement start date, no login, no forms, no confusion. Know if you are on track for the average $925 or closer to the maximum $1507. Plan your retirement with real numbers, not averages. Try the CPP Payment Calculator today.
Frequently Asked Questions/FAQs
What is the average CPP payment at age 65 in 2026?
$925.35 per month. That is what most new retirees actually receive, compared to the maximum of $1,507.65.
Why don’t most people get the maximum CPP?
Because the maximum requires earning near $71,200+ per year for about 39 years, starting CPP exactly at age 65, and having almost no low-earning years. Few Canadians meet all three conditions.
Can I live on CPP alone?
For most people, no. CPP averages only $11,104 per year. The average senior individual needs about $33,600 per year after tax, meaning you will also need OAS and personal savings (RRSP, TFSA, or a workplace pension).
Does starting CPP early or late change the average?
Yes. Starting at age 60 reduces your payment by 36% (roughly $592 instead of $925). Starting at age 70 increases it by 42% (roughly $1,313 instead of $925).
How can I find out my Accurate CPP payment?
Go to the CanadaCalculators.ca Pension Section and click “CPP Payment Calculator.” You will see personalized estimates for ages 60, 65, and 70 using your actual contribution history. You can check it here without signing up.